The Many Benefits of Technical Analysis
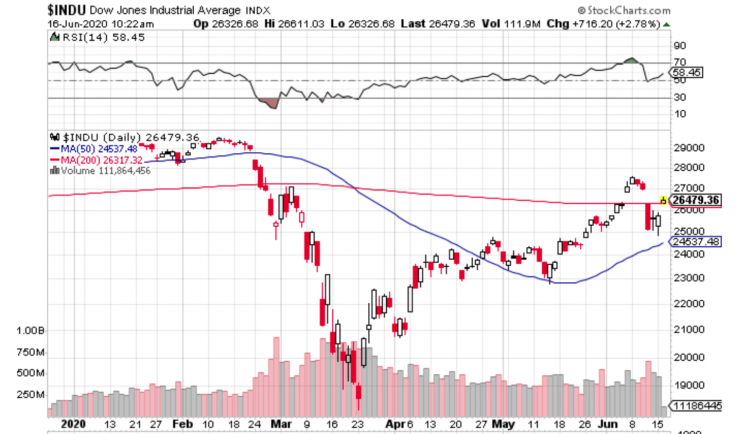
It's an all-too-familiar picture – a rollercoaster ride in the equities markets. From one day to the next, it is virtually impossible to anticipate the direction of major bourses like the Dow Jones Industrial Average (pictured above), the NASDAQ, the S&P 500, et al. The charts make for interesting reading, what with crossovers, short-term moving averages, long-term moving averages, Bollinger Bands, Moving Average Convergence Divergence (MACD), Relative Strength Index (RSI), and a host of others.
Whether it's a Simple Moving Average (SMA), or an Exponential Moving Average (EMA), the analysis is geared towards identifying momentum, trends, and possible price movements. By undertaking daily technical analysis with a powerful set of charting tools, and resources, it is possible to make sense of price movements. Expert traders and investors routinely scrutinize complex charts to understand upper limits of Bollinger Bands, lower limits of Bollinger bands, crossovers of 50-day MAs and 200-day MAs, momentum indicators, oscillators, and the like.
The most obvious shortcoming of technical analysis is that the predictive ability is based on past behavior. A shock to the financial system renders technical analysis 'null and void' until a degree of stability returns and market participants are able to identify patterns once again. Pandemics, oil-price shocks, war, and major policy decisions are examples of shocks that can upend the stability of financial systems as we know them.
Is the VIX a reliable indicator of sentiment?

The Volatility Index (CBOE VIX) operates in real time. It reflects the expectations of market participants over a 30-day period, with an eye to future volatility. Known as the Fear Index, or Fear Gauge, it is one of many useful technical resources available to traders in the market. When prices fluctuate wildly, that is the clearest sign that something is amiss. Over time, these price variations indicate how much movement there is between the high and the low price of that financial instrument. The VIX is used to assess the risk-on or risk-off attitude of market participants with respect to general stocks.
The main statistical elements in a VIX number include deviation from the mean over a period of time. This involves standard deviations of historical price data as well as variance. Another measure to determine volatility is value by way of option prices. If expectations are bullish vis-a-vis a particular stock, or a group of stocks, it is possible derive to level of volatility. It should be stated that the VIX is reliable insofar as it correctly captures the degree of uncertainty that pervades the market. When the VIX number is high, there is lots of selling taking place on the markets. Consider the VIX data in recent times:
• March 17, 2020 – 75.91
• April 17, 2020 – 38.15
• May 15, 2020 – 31.89
• June 14, 2020 – 34.40
It comes as no coincidence that these extremely high VIX numbers coincide with the worst of the coronavirus pandemic. With a risk-off approach to equities in effect in March, with companies shuttering en masse, layoffs by the tens of millions, and fear pervading every conceivable facet of the financial markets, VIX numbers went through the roof. Prior to that, in January, February, and early March 2020, the fear gauge was hovering under 15.
Economic Indicators Provide Powerful Signals for Trading Activity
Economic indicators include a host of variables which can be compared to forecasts and prior results. Popular economic indicators include the strength of the country's currency, stock market activity, the yield on 10-year government bonds, GDP, unemployment, non-farm payrolls, inflation, interest rates, balance of trade, manufacturing PMI, nonmanufacturing PMI, services PMI, retail sales, and more recently the number of coronavirus cases, coronavirus deaths, and coronavirus recoveries. When viewed in perspective, all of these economic elements provide powerful signals for the community of traders and investors around the world.
Strictly speaking, technical indicators have a laser-sharp focus on historical trading data. Technical indicators do not focus on profits, earnings, and revenues – that falls into the realm of fundamental analysis. Day traders are more interested in scrutinizing the short-term movement of prices, and they rely heavily on technical indicators to do precisely that. In today's times, technical indicators are more important than ever, with wild price swings characterizing the performance of stocks across the board.


