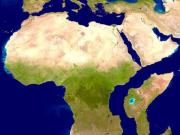
Scientists have been using satellites to check natural processes, events of living systems and human activities which determine the present and the future of the Earth.
NASA has been observing November 13 -17 as a week to share its satellite observations to tell stories about how it views life from space. It helps understand changes affecting the course of life on our planet.
Satellites have long been in use to check animal habitats, track disease outbreak, monitor forests and even to discover new species. The compilation of the data reflects humanity's advancement and its effects on the life's balance on earth. The rise in atmospheric and ocean temperatures and the resultant melting polar ice, depletion of forests and the changes in gases in the atmosphere -- all have been detected through satellite imagery now.
Thanks to NASA, here's a glance at all these changes:
Monitoring the single-celled powerhouse of the sea to check carbon dioxide levels
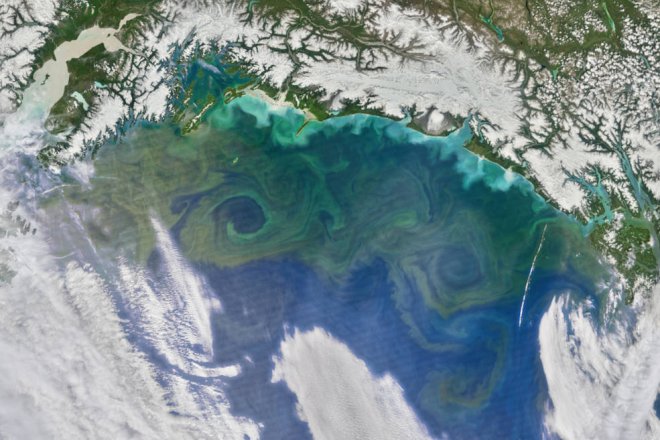
The phytoplankton, also known as the grass of the ocean, is the single-celled, plant-like organism which acts as a primary source of food for the earth's ocean world. They usually bloom when water currents distribute iron into the nitrogen-rich waters to create a nutrient-rich environment for them. They are the most abundant life form in the ocean. The carbon dioxide concentration in the atmosphere has been calculated by checking the presence of the phytoplankton.
Scientists have been observing the global phytoplankton populations ever since 1997 using Sea-Viewing Wide Field of View Sensor (SeaWiFS) and different satellites, ships, and aircraft.
Predicting cholera bacteria outbreaks
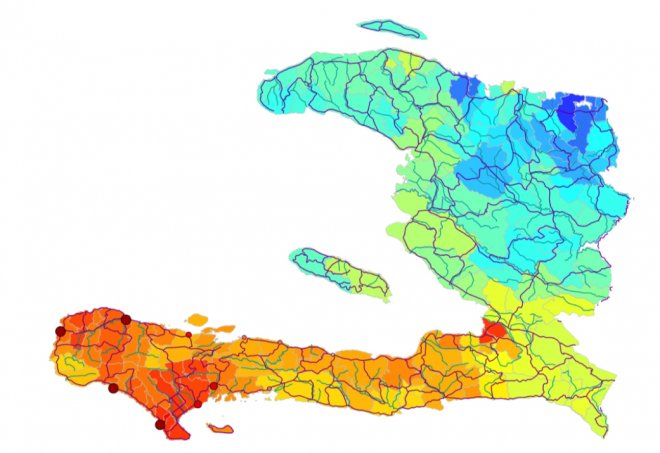
Scientists use various satellites to check the conditions which promote the spread of Vibrio cholerae, the Cholera bacteria. The scientists at the University of Maryland and West Virginia University used satellite data to study air ocean temperature, salinity, precipitation, and chlorophyll concentrations as indicators of the presence of the Vibrio cholerae in water.
Microbiologists Rita Colwell at the University of Maryland and hydrologist Rita Colwell at the West Virginia University have estimated the risks of a cholera outbreak after major environmental hazards. They found that factors like population mass, precipitation data, air temperature determine the scale of cholera impact.
Viewing life on land
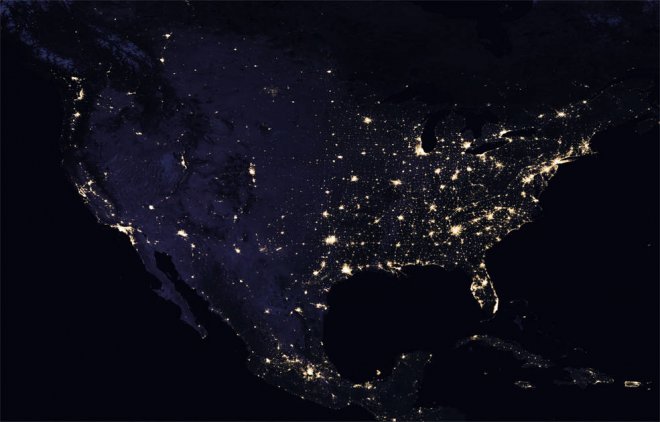
Scientists use satellite imageries to check the life across the world. The human activities like driving cars, constructions and farming and their impacts on the planet were studied.
NASA's Black Marble, the global map of the earth which works during the night and senses the human activities during various seasons by checking the light emission, ia another. It could even detect the changes in the light emission during holidays and celebrations. It was useful to bring help to people in disaster-struck regions or to find lost people.
Track bird population
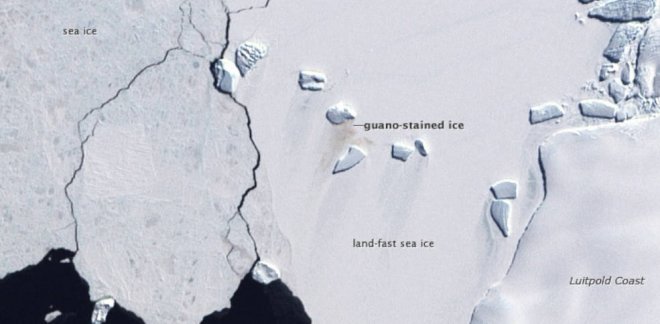
Bird populations, their migratory pattern and nesting regions could be calculated using the satellite data. Scientists had intensively tracked the Antarctica's emperor penguin using this method.
Satellite imageries helped to find 54 emperor penguin colonies along the Antarctic coast by studying its excreta using Landsat images. It was earlier difficult to detect them using aerial views as the penguins had black and white coats which would blend with the color of the shadows of the ice.
Observing plant life
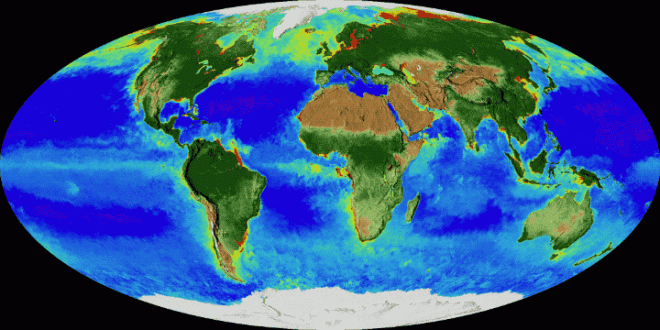
Scientists could understand the plant growths and the factors which affect them in land and sea through their satellite tools.
SeaWiFS (Sea-Viewing Wide Field-of-View Sensor), a satellite-borne sensor designed to collect global ocean biological data, and instruments including NASA/NOAA Visible Infrared Imaging Radiometer Suite and Modern Resolution Imaging Spectroradiometer are used by the scientists to get a global perspective of plant life on the planet. The effects of natural disasters, droughts or even agricultural practices on plant life could be analyzed using the satellite images.
Studying life under the sea
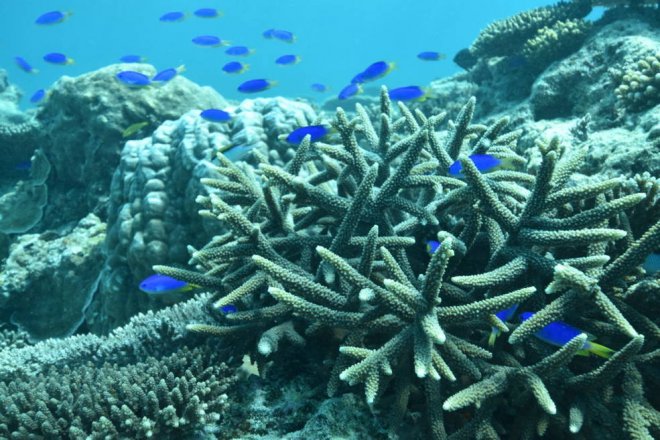
Coral reefs, which provide protection for a huge proportion of ocean life suffers from coral bleaching as it loses algae in its tissues due to warming of ocean waters. Though the coral bleaching does not destroy the corals as a whole due to its ability to regenerate, the process is hazardous to the ecosystem which thrives in its habitat. A large number of microorganisms, marine animals, and plants which are dependent on corals may face extinction due to loss of habitats.
NASA satellites have been used to monitor the life in oceans. Researchers use the data to study the health of coral reefs which are considered the most vulnerable ecosystems.
